Google Search Console has a crawl stats report that offers a ton of information about how Google is crawling your website. It is a great way to see if Google is having any issues crawling your website.
If your website is having crawling issues, then SEO efforts will be wasted!
This article will help you understand how to read the different crawl stat reports. Much of the data is pulled directly from Google, just rewritten to try and make it easier to understand!
What is the Google Search Console crawl stats report?
The Google Search Console crawl stats report provides insight into how Googlebot crawls your website and if there are issues doing so.
It shows details such as the number of pages Googlebot has crawled, average time spent downloading a page, crawl errors, and more.
Data provided in crawl stats:
- Number of crawl requests
- Download size
- Average response time
- Host details
- Breakdown of crawl data with response code, file types, etc.
Important facts to know:
- Data is for the last 90 days
- The crawl stats report does not reflect all crawl requests made, just a portion of them
- This report is generally recommended for sites that have more than 1,000 pages, but I find it useful to look at it on all sites
Where to find the the crawl stats report.
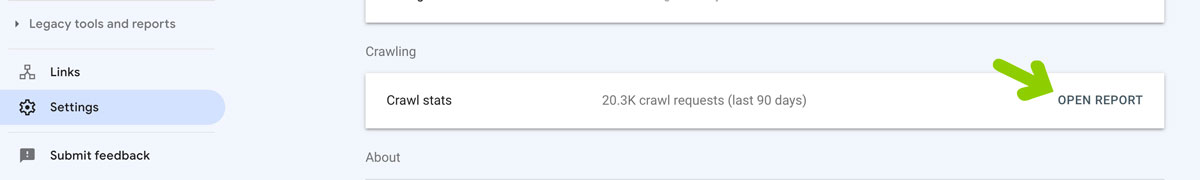
The report can be found by going to Settings in GSC.
Then click open report to the right of crawl stats.
How to read the crawl stats report.
Reading the crawl stats report may seem a bit scary, but I hope this will help you feel like you “get it”.
Once you click Settings and then Open Report in the crawl stats box as shown about, you will see a screen like what is shown below.
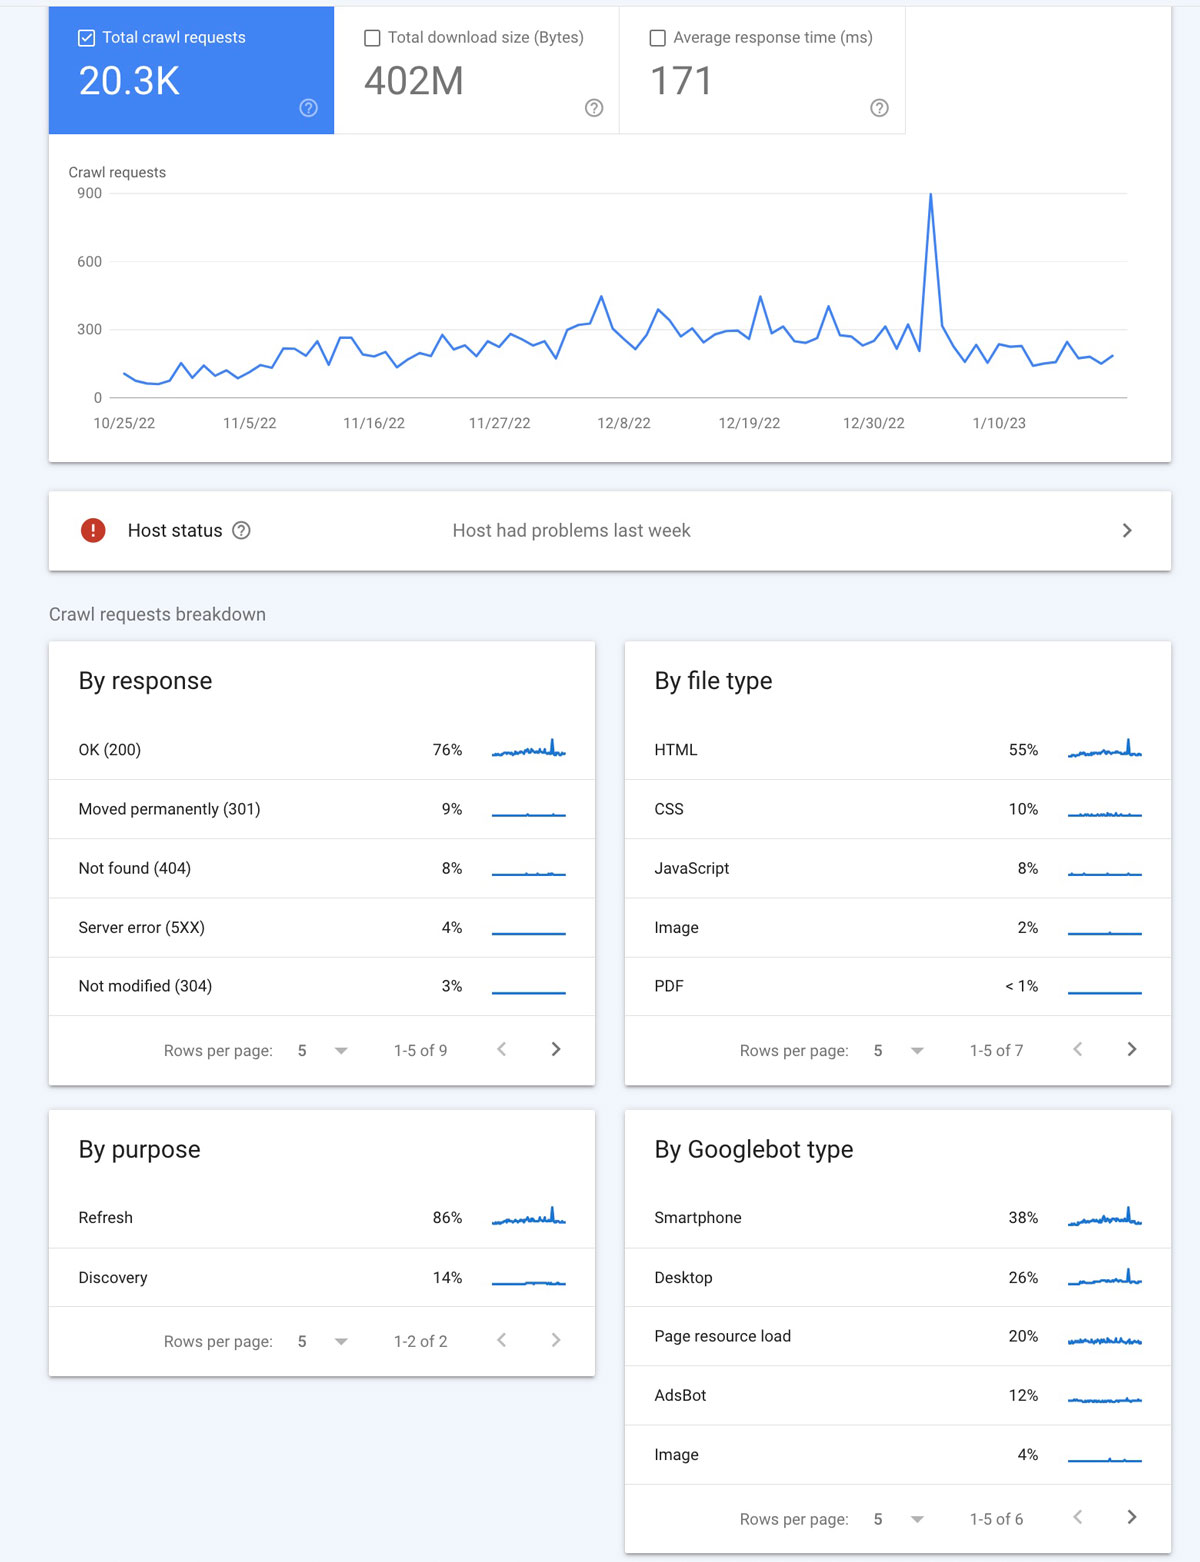
I am going to break down each of these sections below.
1: Top Section
There are three sections within that top block where the line graph is.
✔️ Total crawl requests
This number reflects the total number of requests made to your website. This includes requests that are both successful and not successful.
A few reasons a request ay not be successful are:
- Redirect errors
- Server or DNS issues
- Robots.txt problems
✔️ Total download size
The download size is the total of size of all files and resources crawled. This might include things like images, CSS files, HTML, and more.
✔️ Average response time
The average response time shows how long it took a crawl request to to fetch all resources from your site.
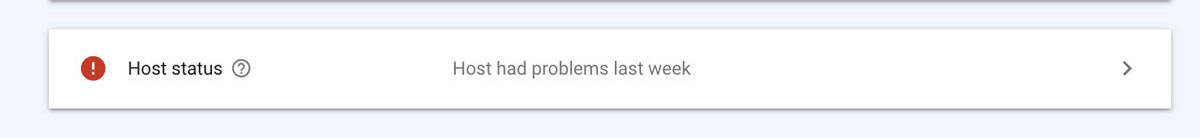
2. Host Status Section
Host status tells you whether Google had any issues when trying to crawl your website.
Definitely one of the more important checks on this list!
There are three different statuses:
- Green solid check means not problems in the last 90 days
- Green outline check means crawling ability was impacted in the last 90 days, but the issue was over a week ago.
- Red means there was a crawling issue in the last week.
Clicking on the host status block will take you another page where you can find a few more details.
As shown below, this website had a problem recently so we would definitely want to check it out.
When you click on that block you will see a list of possible issues as shown in the image below. These include:
- robots.txt fetch – if this is red it could mean your file does not exist, is empty, or is formatted incorrectly
- DNS resolution – if this is red you may have issues with your DNS setup at your registrar
- Server connectivity – if this is red then there is some type of issue with your server response
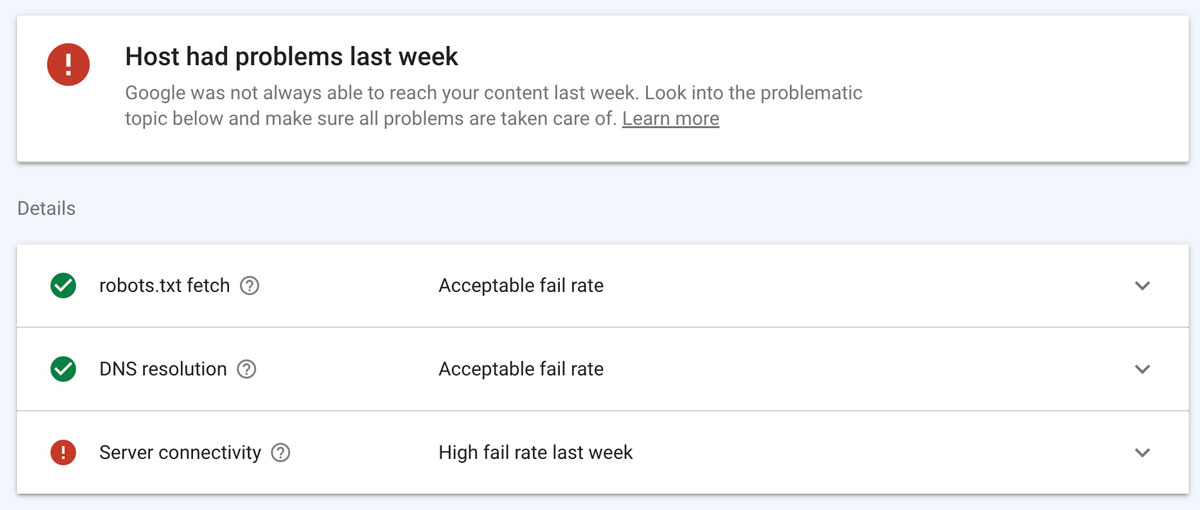
Of course I need to look into the server connectivity issue to see what is going on. Clicking on that line item will show more details.
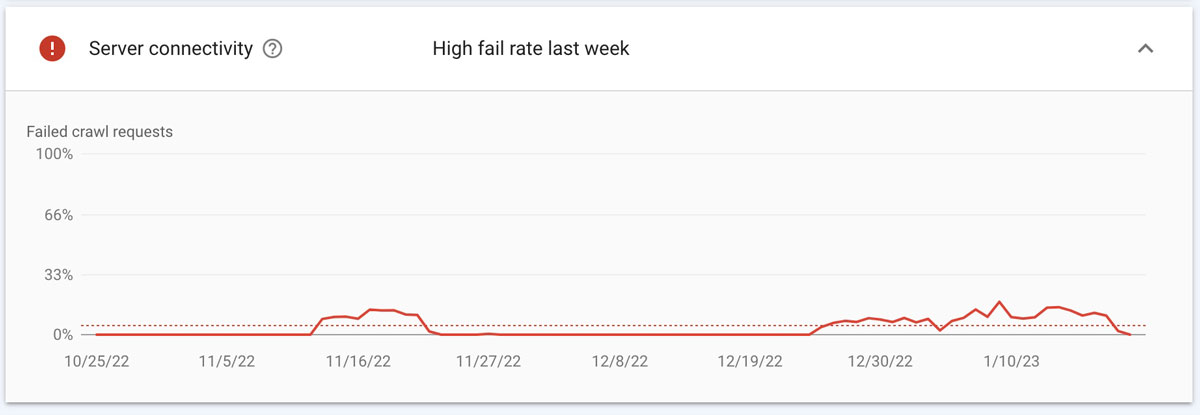
In the below image there are peaks where there were server issues.
In this case, they are not a concern because these were during periods we were doing work on the website and cleaning up lots of code. But, you might need to dig even deeper if you were not doing any site work!
For now, we will monitor it and make sure it gets back into the green soon.
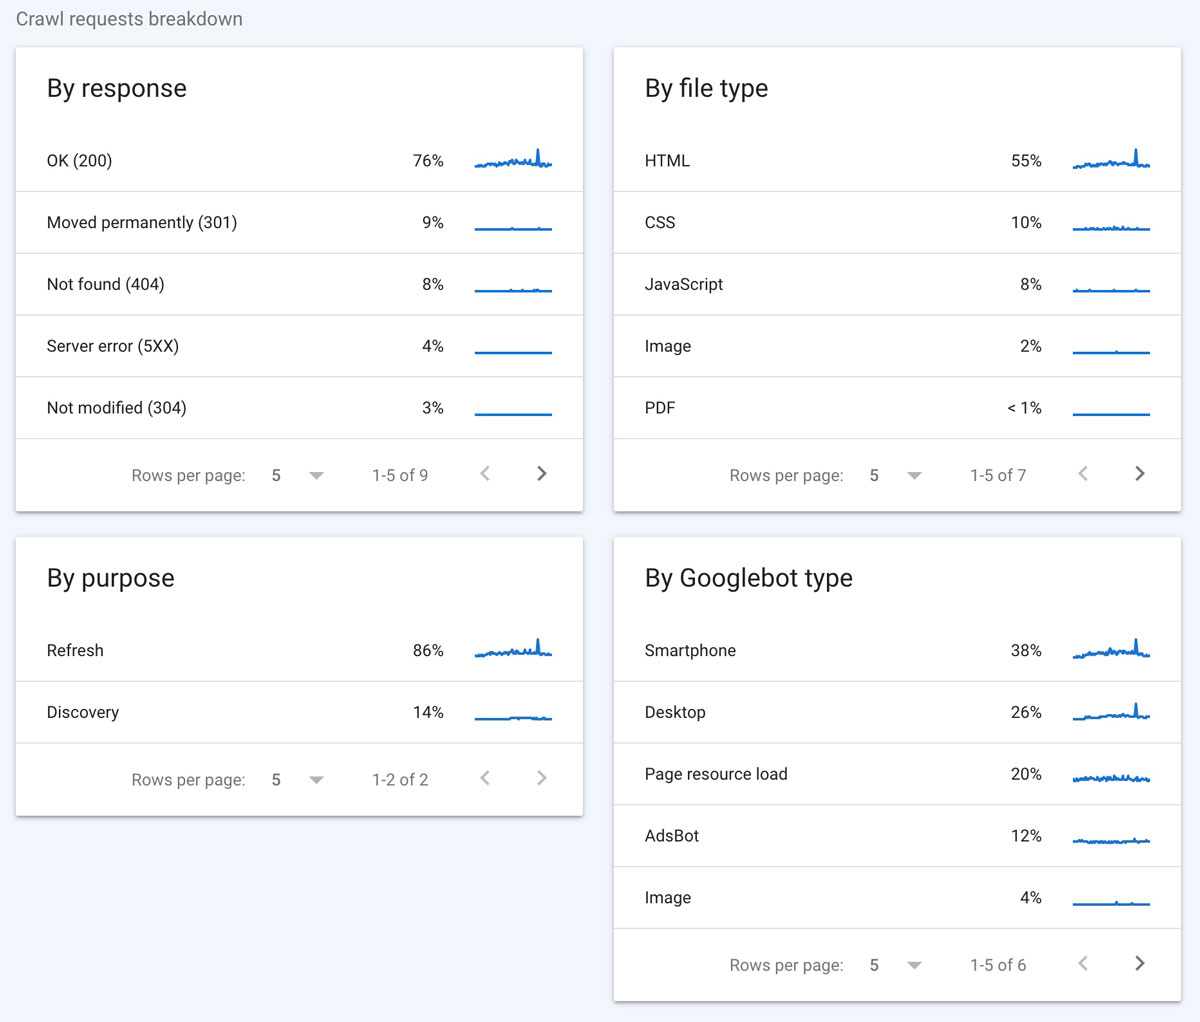
3. Crawl Requests Breakdown
The lower part of the crawl stats page gives a bit more detail about the crawl requests so you can dig a bit deeper if you find issues.
Below are summarizations of each of the four blocks:
- By response
- By file type
- By purpose
- By Googlebot type
So, what are we looking at which each of these?
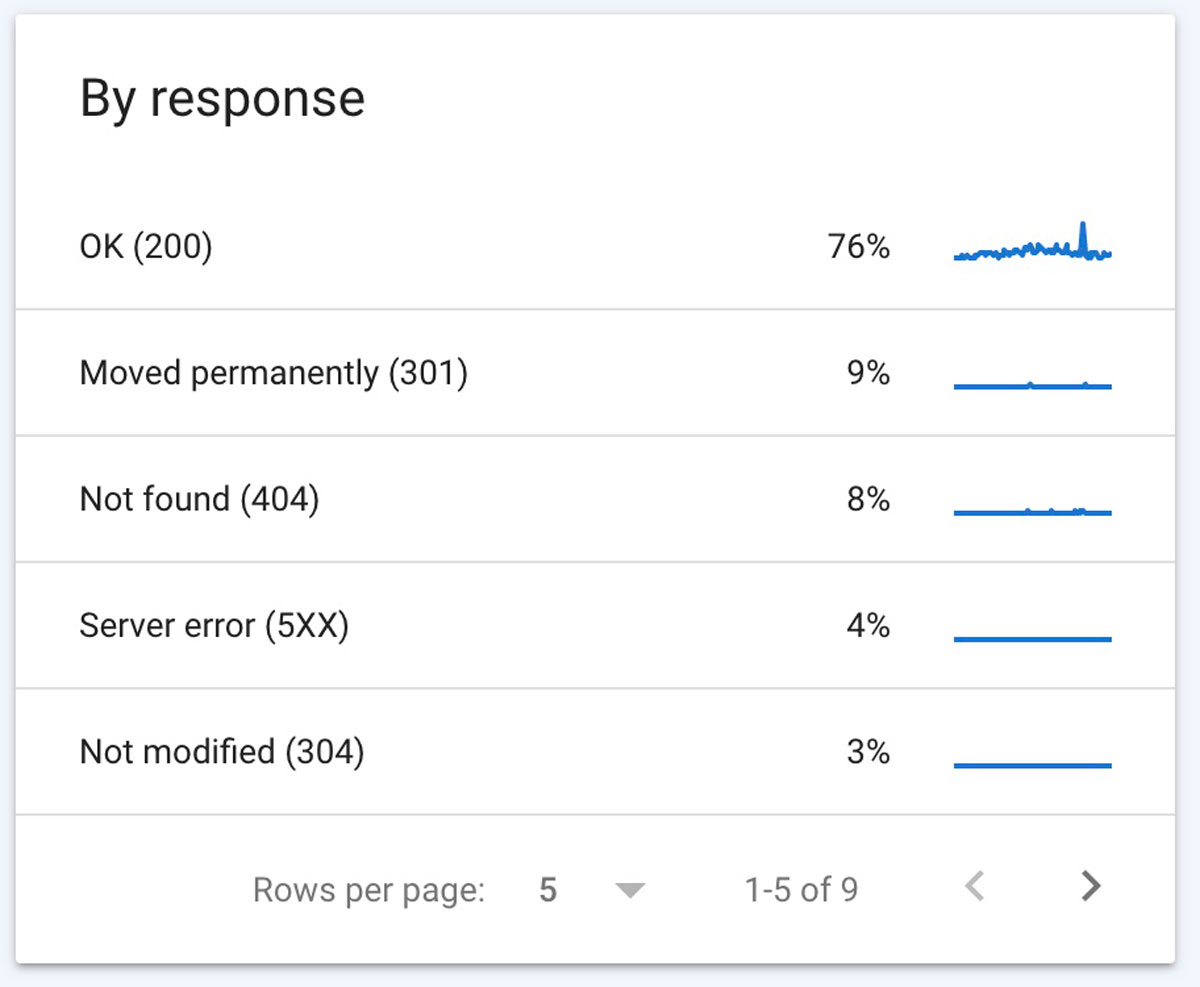
✔️ By Response
When Google crawls your website it will receive a response code which will tell us if there are issues with the page.
Below we can see a 200 response was received by Google for 76% of the pages it crawled. This means those were all OK and retrieved without issue.
The other codes may – or may not – be good depending on your website. I would check the 3xx or 4xx errors to make sure nothing seems wrong.
The responses below are more uncommon, but can be more serious issues impeding your organic growth. You can learn more about all of these crawl stat responses on the Google Search Console help center.
If you see any of the below, then you will definitely need to investigate.
- 5xx error
- robots.txt not available
- Unauthorized (401/407)
- DNS unresponsive
- DNS error
- Fetch error
- Page could not be reached
- Page timeout
- Redirect error
- Other error
To analyze in more detail, click the response and you will be taken to another page where you can see the pages that are causing those errors.
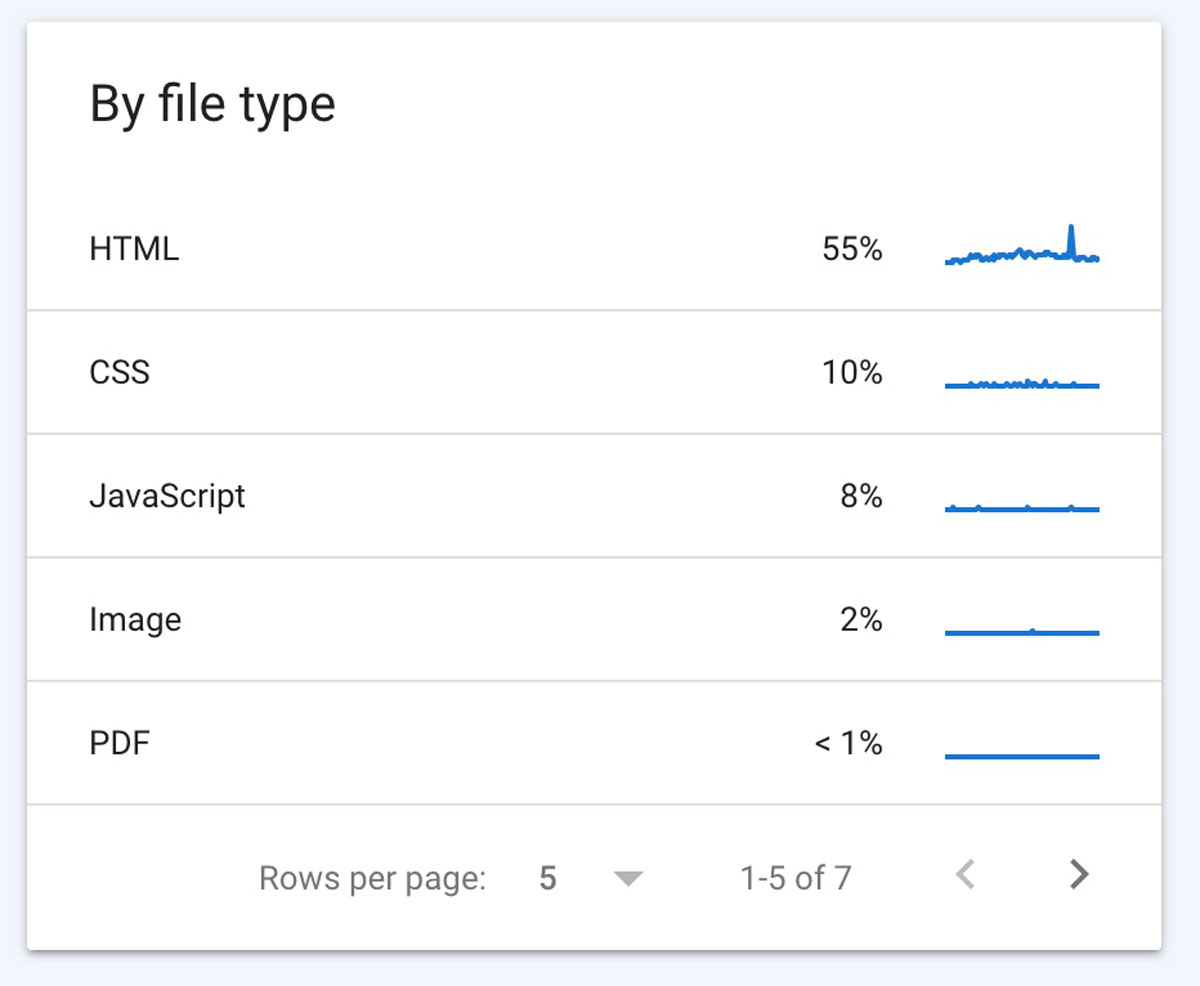
✔️ By File Type
The file type will let you see what kinds of files may be having crawl request issues. The percentage next to each file type represents the responses for that type of file.
Clicking on each file will offer more information about the crawl requests made, response time, and download size. Reviewing these can help you assess any crawling issues that might be happening.
If you see spikes in any of the data, it could mean there are issues that can be causing not found errors or slowness in load.
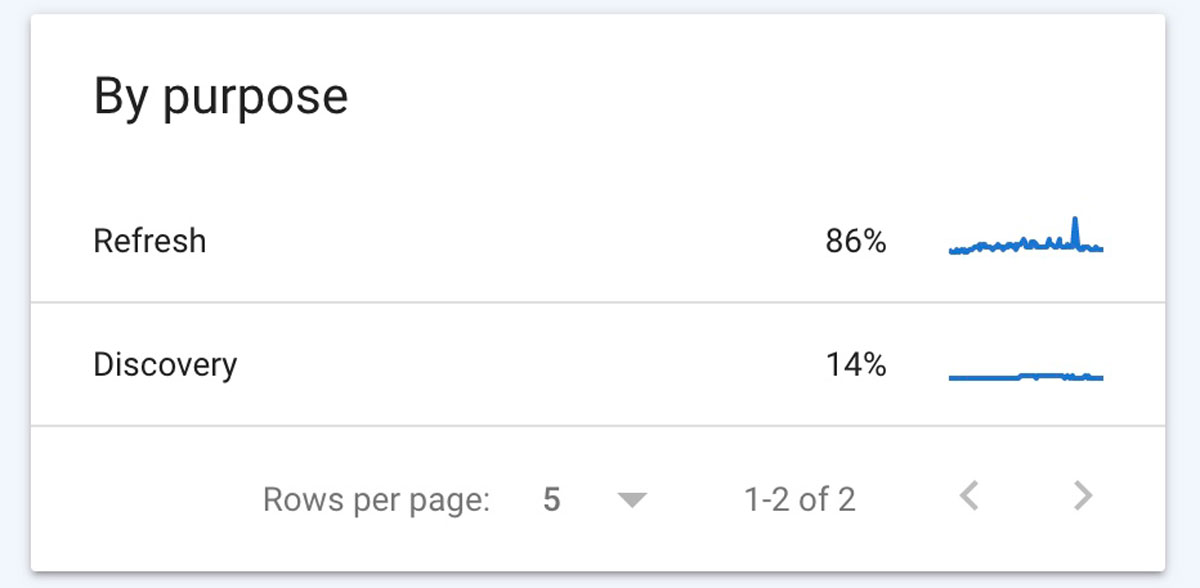
✔️ By Crawl Purpose
This is simple one! There are two crawl options shown:
- Discovery which means the URL had never been crawled before
- Refresh which is a repeat crawl of a known page
Why is this useful?
You can get a good idea if your content is being crawled. For example, if you added a lot of new content, you should see a spike in the discovery purpose report.
You can checkout refresh every once in a while when you update your content to see when Google is coming to re-crawl it.
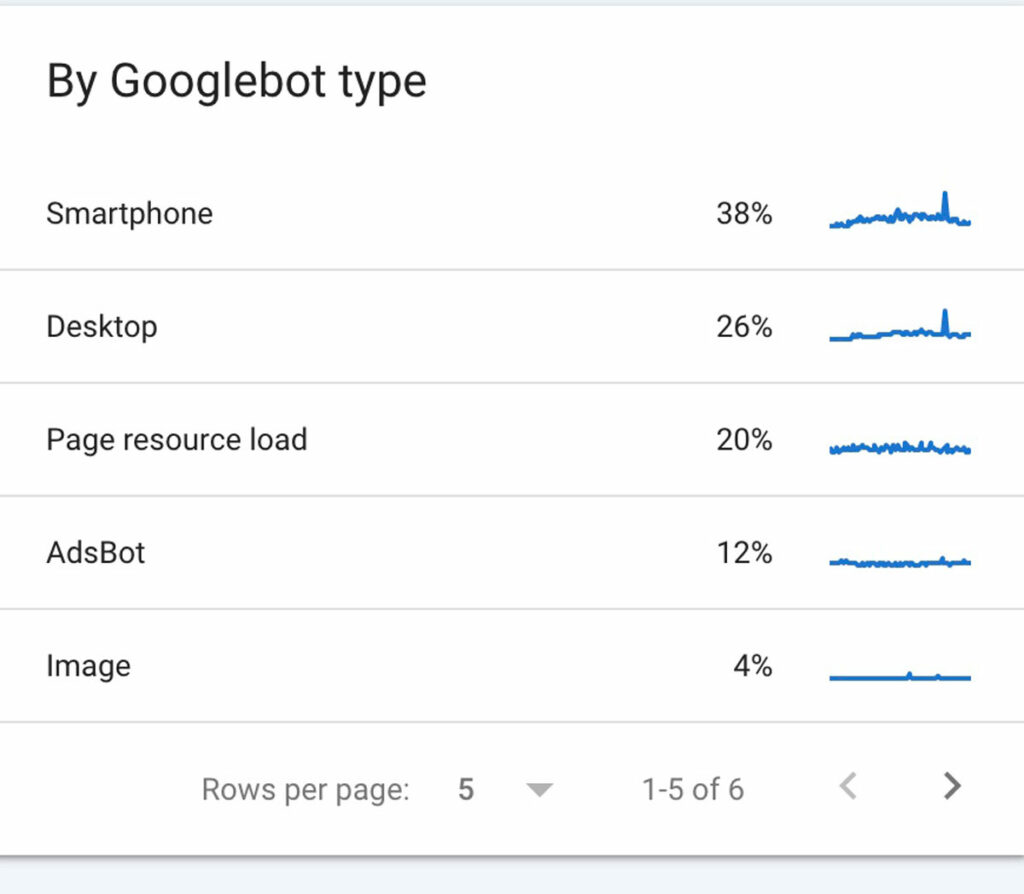
✔️ By Googlebot Type
Googlebot type can help you identify which Google user agents have crawled your site recently.
Below is sample chart showing all the different types of bots that have visited the site and the percentage of visits by each.
There are a few others as well like vide, storebot, and other agent type.