How fast your website loads and its performance has never mattered more for SEO than it does today. Google rewards websites that offer their users the best experience – which means great content, site speed, and usability will help you lead the pack in the SERP results.
But, working on page speed is probably one of the most complicated parts of owning a website. And, unfortunately, it can be pricey to hire consultants to do it for you.
So, why not dive in and see what you can do on your own?
You just might surprise yourself with what you can accomplish.
This article will focus on how to use one of my favorite tools, webpagetest.org to improve your site speed and performance.
Some of this can be very confusing – but I am going to do my best to make it as easy as possible to understand.
I am only focusing on the basics for this article! Webpagetest.org is an advanced tool with many options and settings, but to keep this article easy to understand, I am going to minimize the customizations.
What Does WebPageTest Do?
Webpagetest is a website site speed tool that can help you identify why your WordPress website is slow. It will check for page speed, core web vitals, image optimization, and so much more.
Once you find the issues you can then put the fixes in place to make your website load quickly for visitors.
It offers options for testing in a variety of countries, device types, and how visitors see your website if they visit for the first time – or the third time.
How Does WebPageTest Work?
Webpagetest uses real-world browsers to crawl websites and deliver important information about the speed and performance of the site.
It can be used on their URL or more advanced users can download it on their own server to use internally. It is one of the best performance tools out there and has more options than I could possibly cover!
How much does WebPageTest Cost?
WebPageTest currently offers two plans:
- WebPageTest Starter is a free plan that offers users a glance at all the primary performance metrics a website owner should be aware of.
- WebPageTest Pro is a premium subscription that offers a variety of features that are not included in the starter plan. Premium testing locations, high-priority testing, and experiments are 3 of the pro features that are beneficial. Plans start at $18.75 per month and a discount applies for annual plans.
How Often Should A Website Be Tested?
I recommend website owners run a test every few months. Personally, I do a check once a month on all of my websites.
Google is always changing their factors for speed and technical guidelines, so doing a test often will help you stay ahead of the game. The better your website performs for users, the better chance you have for ranking well, so do not skimp on this!
What Kind Of Tests Can Webpagetest Run?
Webpagetest can actually run a few specific tests for your website. I typically choose Site Performance when starting a new test.
Below are the test options:
- Site performance
- Core Web Vitals
- Lighthouse
- Visual Comparison
- Traceroute
Keeping Things Simple
As you can imagine showing you how to use WebPageTest can take hours!
I am ONLY giving you an overview of metrics I believe you should focus on as a beginner.
This is a very technical topic – but I promise to do my best to make it as easy to understand as possible.
Now, let’s run our first test!
Configuring Your First Speed Test
Below are the basic recommendations for running a test of your website.
Go to webpagetest.org and do the following steps:
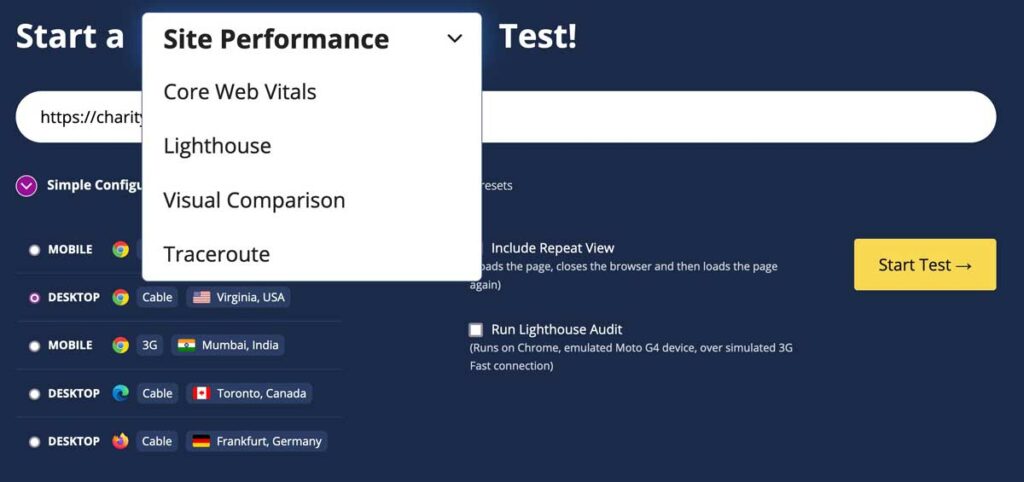
- Start a “” Test – in this dropdown you can choose Site Performance which will give you an overview of all the various performance points.
- Enter your website URL – make sure you enter your URL exactly how the default URL is. If you are https – then make sure you use that so you get the most accurate information. If you use www, then make sure you use that as well
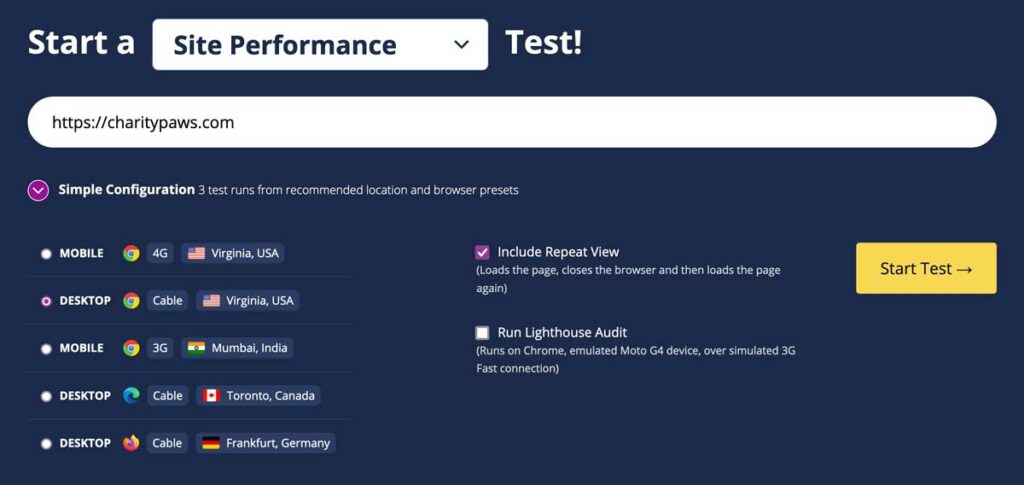
- Simple configuration – choose the area that is closest to where your visitors may come from and the device you get most of your visitors from. So, I would select Desktop / Virginia
- Include repeat view – this will show you how the page renders when someone sees it for the first time, closes the page, and then comes back again later. It is a good check for repeat user experiences. Make sure this is checked.
- Click Start Test
You will see many other tabs and options – but I am not going to address those here since they are very technical. I will do a separate article on advanced options.
What I have outlined above is enough for a general overview of your website.
Reading The Results
Now the fun begins. You will probably be overwhelmed with what you see on the test results page – but hopefully, I can break it down easy for you!
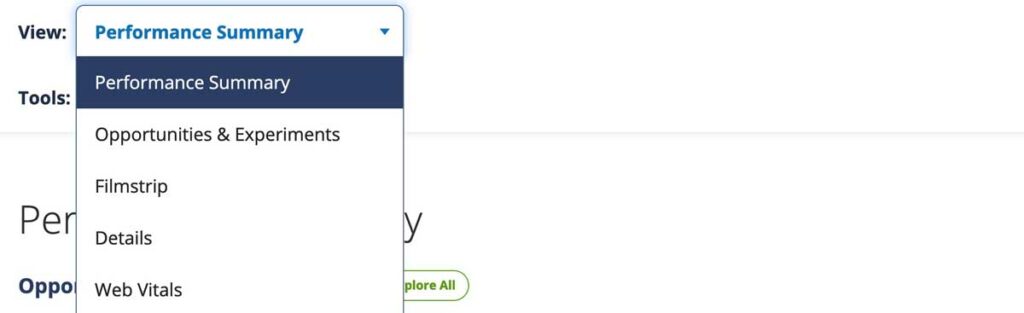
By default, you will land on what is called the Performance Summary as shown in the View dropdown. The performance summary is just that, an overview of your website performance across the board.
You can also select different testing areas to prioritize different factors if you want.
Now, I will try to break down the different results areas so you know what to look for.
Performance Summary
The performance summary page is filled with great information, below is a breakdown of each type of result so you get a better idea of what it does and how to read it.
Opportunities & Experiments
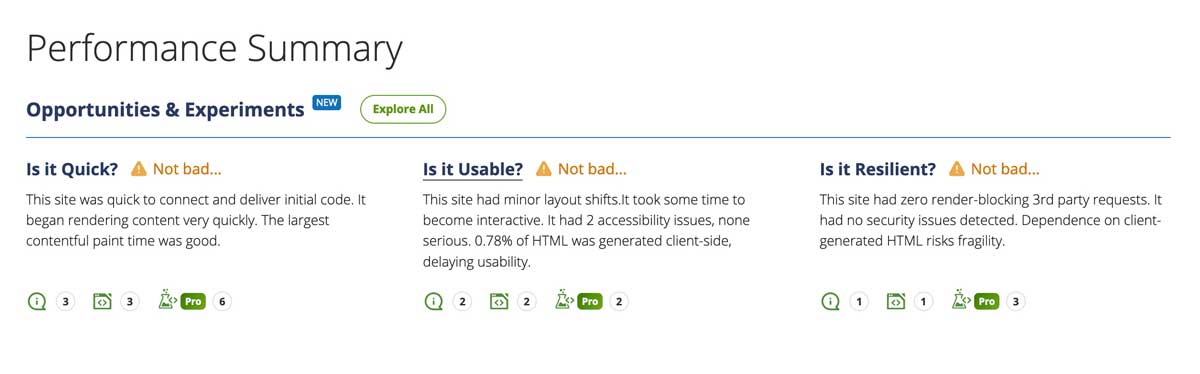
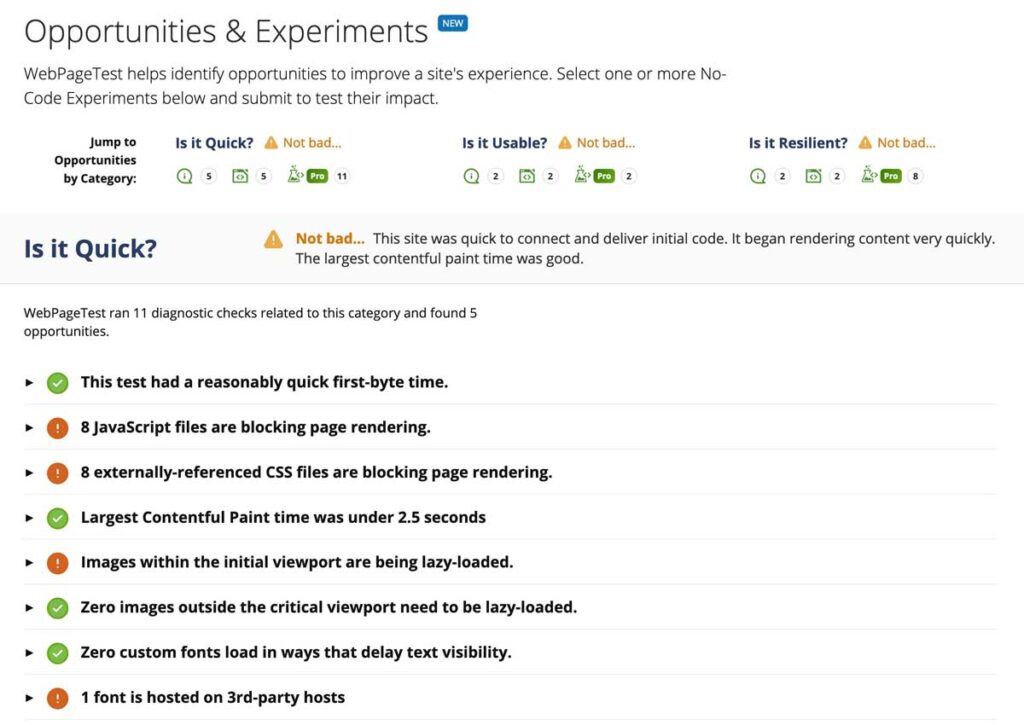
Opportunities & Experiments gives you a general overview of how well your website is performing.
It will tell you if your site is fast, usable, and resilient.
In the below example, we see all there are shown as “not bad” which means the site is acceptable but there is definitely room for improvement. Below each of the 3 sections you can see 3 icons which reflect opportunities, tips, and experiments available.
Experiments are only available in the Pro version of the tool.
But the opportunities and tips are important items you should look at!
Click on the Explore All button to the right of Opportunities & Experiments and you will find all of the information you need to understand where your site is not doing well.
In the image below we are seeing the results of the is it quick section.
Anything green means the results are good and anything in red means there are issues that should be addressed.
For this website we can see issues with the following items:
- Javascript files blocking page rendering
- External CSS pages blocking rendering
- Images in initial viewport are being lazy-loaded
- Font being used that is hosted on a 3rd party host
All of these items are actually pretty easy to fix.
- For the render blocking files a plugin like WPRocket, Hummingbird, or Autoptimize can help.
- The image issue is letting you know that an image high on the page is being lazy-loaded – meaning it won’t load until it starts to enter the viewport. Lazy loading hero images or banner images is usually not recommended, so that should be removed from lazy-loading.
- Fonts are best used without a 3rd party host. So moving the files to your own websites is highly recommended.
Once you finish reviewing your is it quick results, then move on to is it usable and is it resilient. Now, you have a full scope of all of your issues.
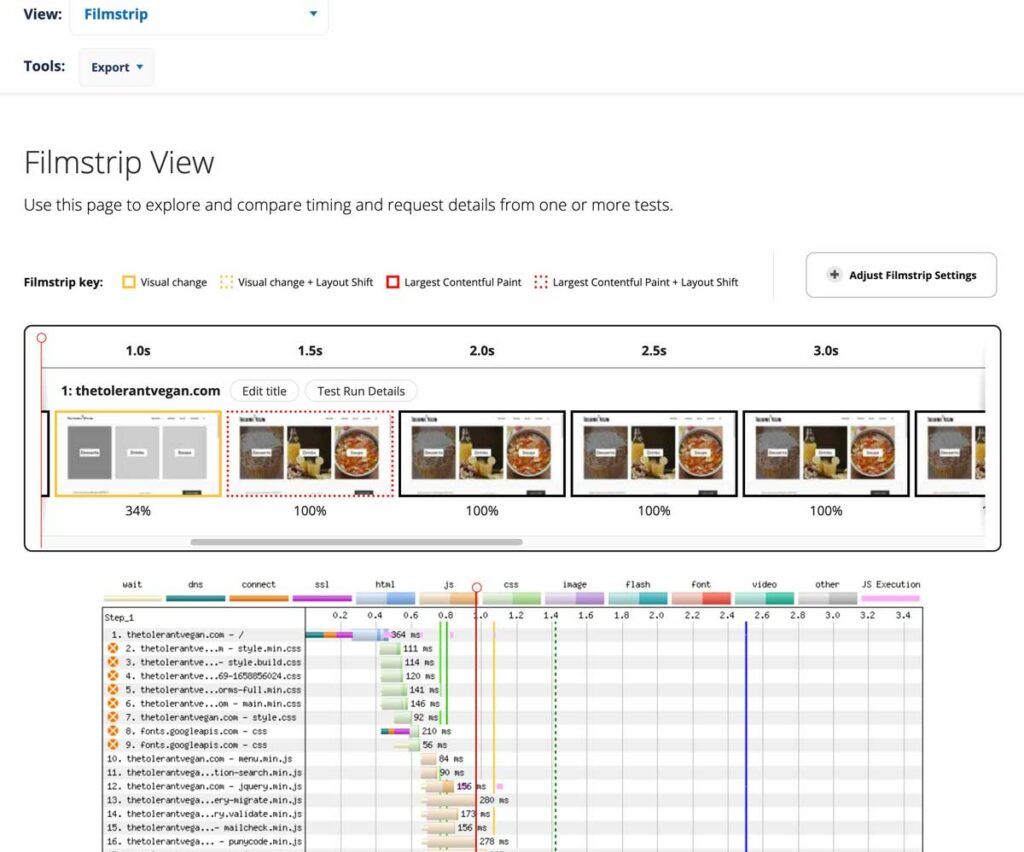
Filmstrip View
The filmstrip view is a great way to visualize how your website is loading for users. It can help you see how items are being loaded and where you might be able to improve the page load.
You can scroll through the filmstrip and match up the thumbnails with the files in the waterfall below to see what files might be impacting load times.
Scrolling further down the page will show a variety of graphs and charts as well.
Details
This is probably the most detailed part of the test. It provides a ton of data about the metrics for your website in regards to loading and processing.
I am only going to deep dive into observed metrics and the waterfall as those two sections can offer most of what you need to succeed.
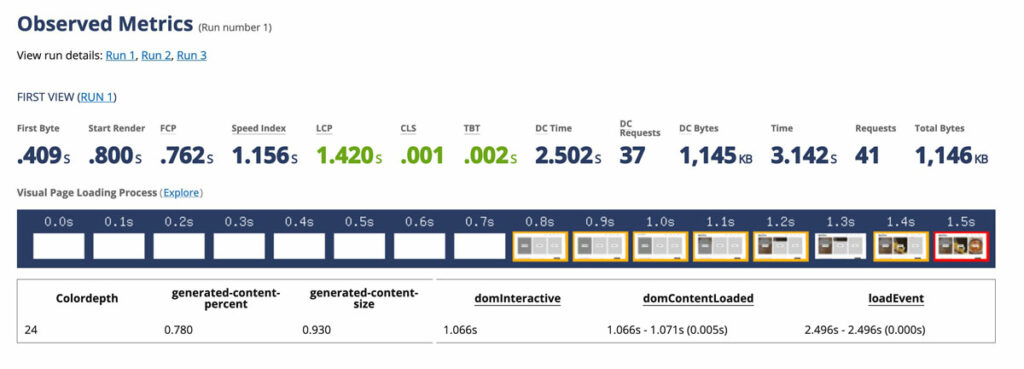
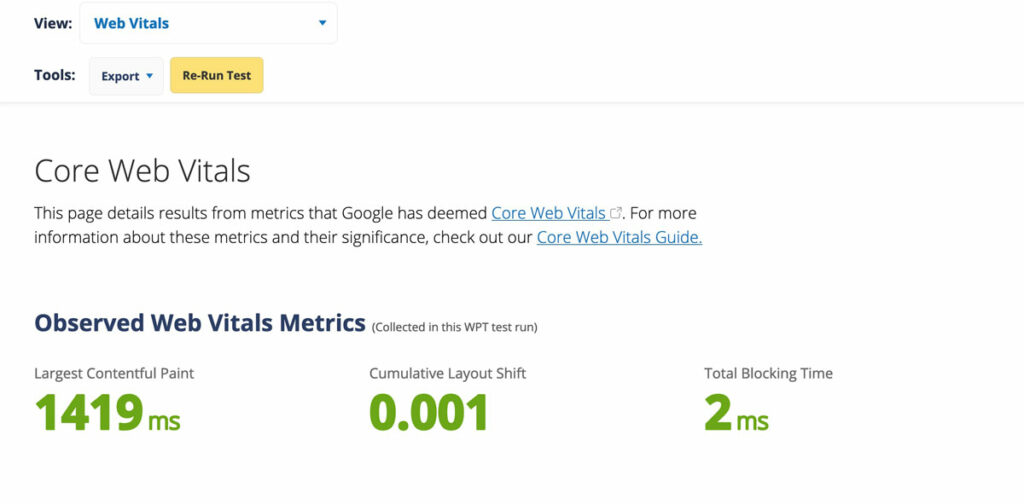
Observed Metrics
The observed metrics section offers a lot of metric data to help you understand how your website is loading. You can view the metrics for the 1st, 2nd, or 3rd run to ensure repeat visitors are getting as good of an experience as new users.
Below are only the metrics we are going to look at for this guide:
- First Byte – First Byte is the responsiveness of a web server to download your website content. Poor hosting companies will have higher First Byte times. It is recommended that First Byte measures 1 second or less.
- FCP – First Contentful Paint is how long a website takes to visually show any part of the website to a user (this might be header or navigation). Recommendation is that this should be 1.8 second or less.
- Speed Index – Speed index is an indicator of how fast content is shown during page load. 3.4 seconds or less is a good score.
- LCP – Largest Contentful Paint is how long a website takes to visually show the largest element on a page (this might be a hero image). Recommendation is that this should be 2.5 seconds or less.
- CLS – Cumulative Layout Shift is a metric that measures how stable a website is for users. This metric assigns a value to layout shifts on a website, for example buttons that move, or images that push down text. It is recommended that websites have scores of 0 for CLS.
- TBT – Total Blocking Time is the amount of time between the FCP and time a user can interact with a website. If many files exist that block that interactivity from happening, it is assigned a TBT value. Recommended TBT time is 200 milliseconds or less.
- Time – Also called load time, this is the time the websites takes to load the entire website including all files, images, and content. I aways try to get a site as fast as possible with a target of 3 seconds or less.
- Total Bytes – Total Bytes (also called page size) are the size of all the files that need to be downloaded. It takes the number of requested files and provides data on the size of those files. The lower the number the better, but a recommendation would be to have pages be 1MB (1000kb) or less.
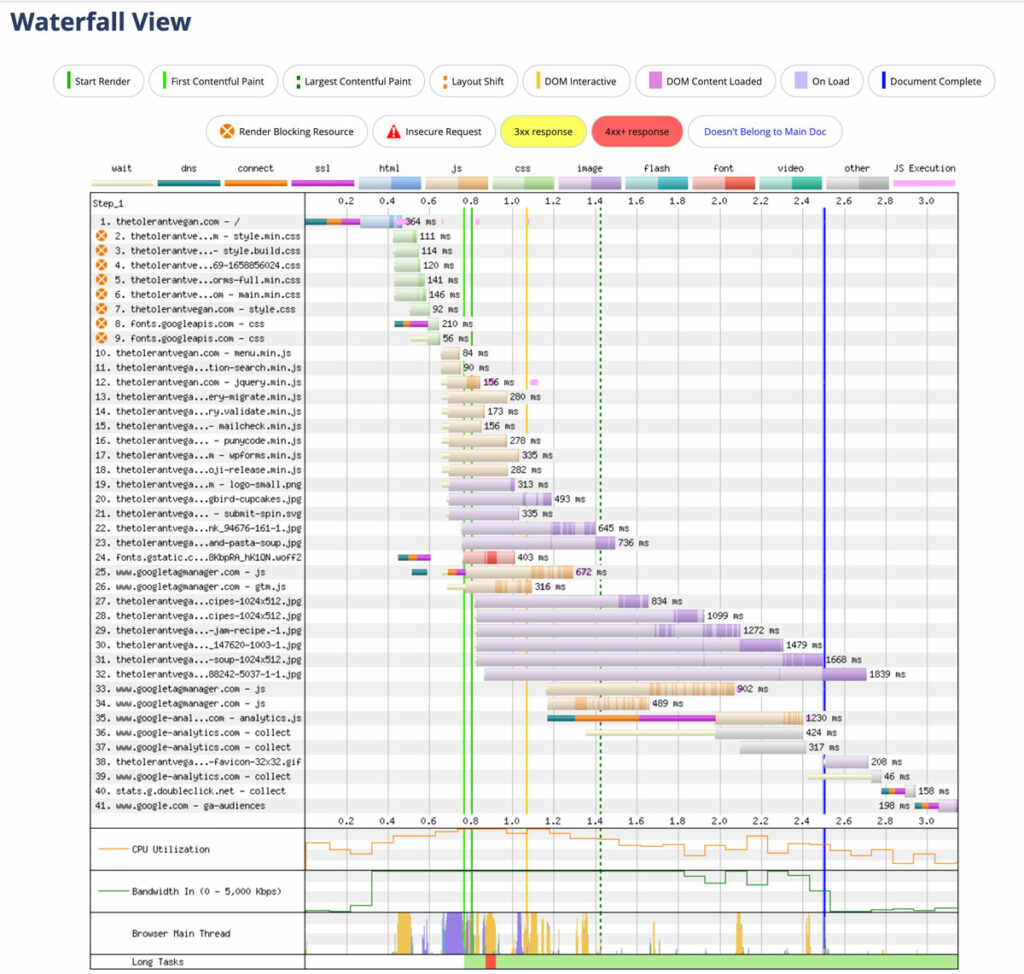
Waterfall View
The waterfall view is a great visual to help you see how your website is loading. It shows all the files, how long they take and will show you when there are problems that may be causing load time delays.
The waterfall below shows issues with render blocking resources.
There are 8 files that are blocking the rest of the website from loading, but deferring or asyncing those files the load time will be much faster and offer users a better experience.
Web Vitals
Web vitals does impact SEO so it is important to understand how your website is doing. It is a Google driven initiative that provides quality signals about your website’s performance. Web vitals focuses on largest contentful paint, first input delay, and cumulative layout shift. The better performance in these 3 areas, the better your web vitals score.
These data points can also be looked at in PageSpeedInsights.
The data for these metrics is always changing which is why it is important to run tests every so often!
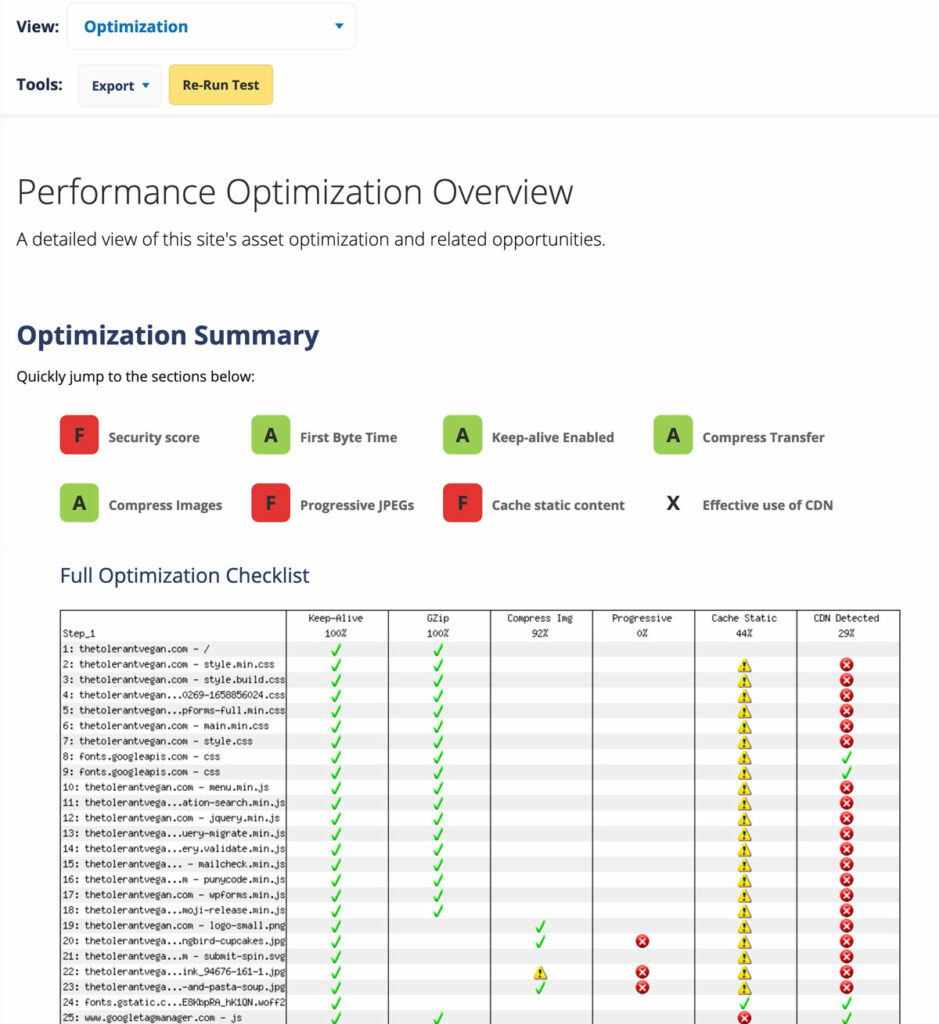
Optimization Summary
This report is a quick snapshot on a website’s assets and how they can be improved.
The different factors that are assessed include:
- Security score analyzes the use of security headers in your website. Security headers are important for ensuring your website is safe for users and from hackers.
- First Byte Time is how quickly your hosts server is responding to the request for files to be downloaded so a user can access your website.
- Keep Alive Enabled is a feature that is set at your host and helps speed up a website by keeping a persistent connection to the server to access the needed files.
- Compress Transfer is also called Gzip. Gzip compression helps to reduce the size of the files being transferred from the server and can greatly improve page speed and the time it takes a page to render.
- Compress Images is a metric that shows whether images are being compressed to display in their smallest possible format without losing a lot quality.
- Progressive Images load images in layers and will slowly increase in quality while non-progressive will load immediately which can delay load times.
- Cache Static Content is a way of allowing website contents to be “stored” in a browser to be delivered faster than having to pull it from the server over and over.
- Effective Use Of CDN is an option that can have a positive impact on site speed. It is not required to use a CDN but is often recommended.
In the example below we can see that the website needs some work on their Security Score, use of Progressive JPEGs, and caching.
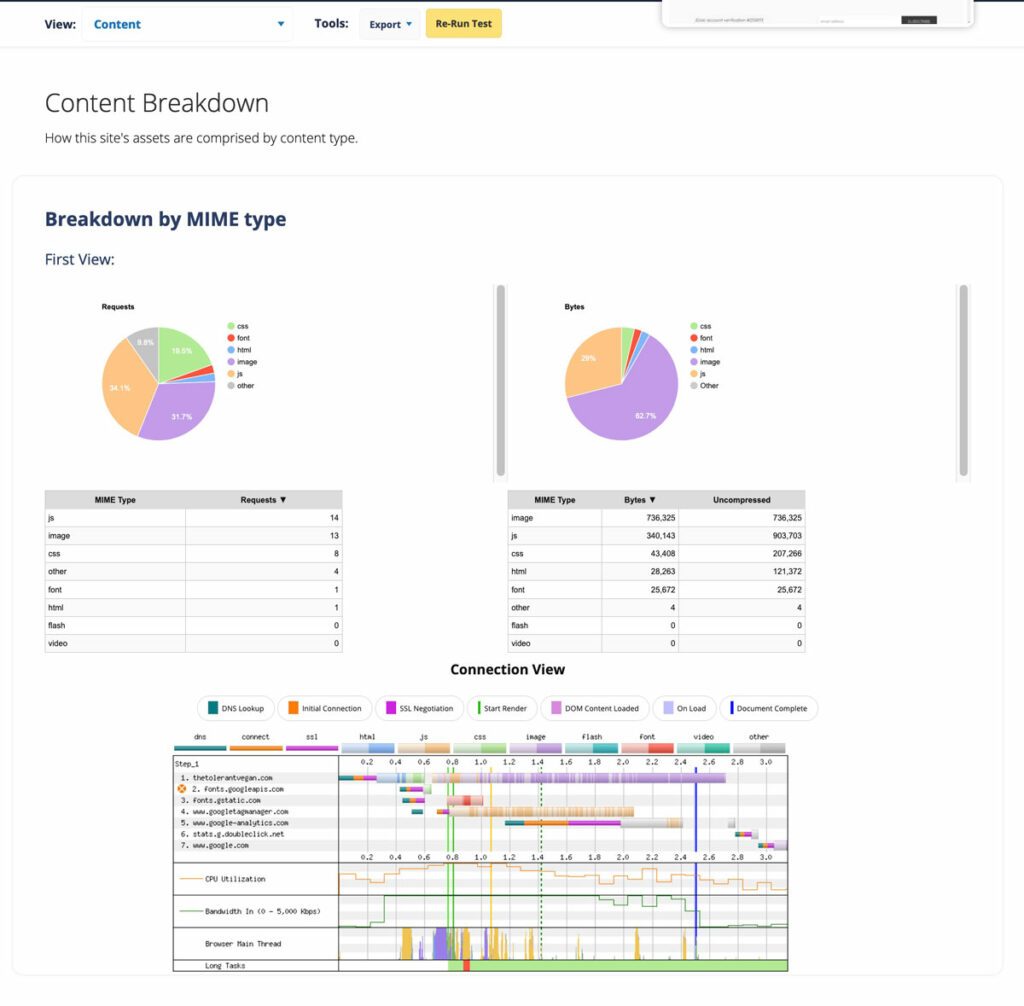
Content Breakdown
A simple visual to show you how your website is broken out into different content types and metrics for each of the types in regards to sizes and number of requests.
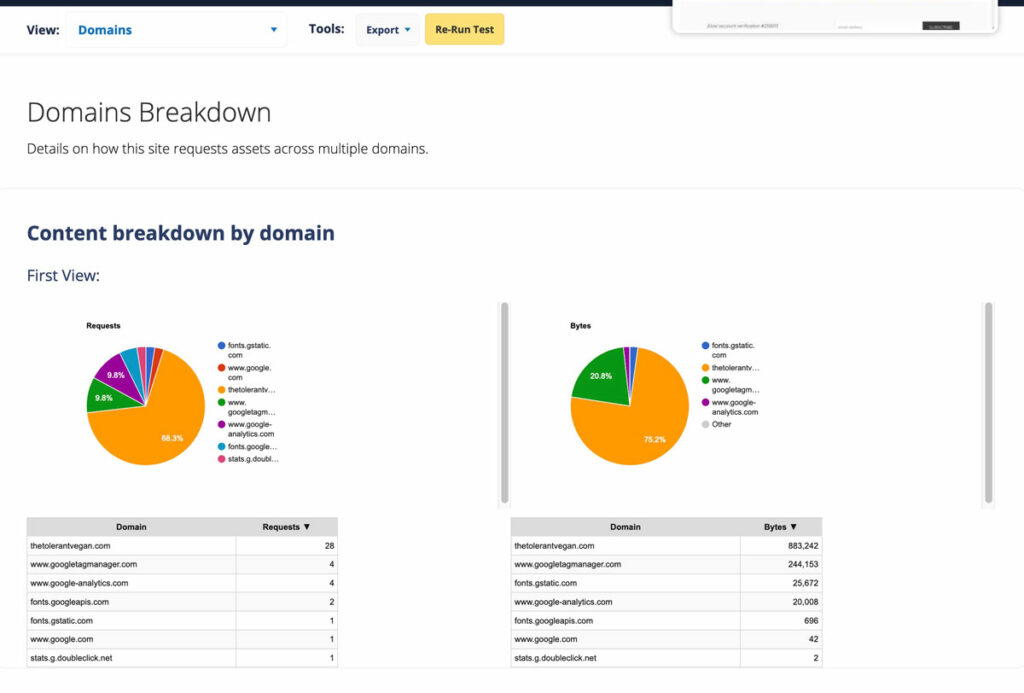
Domains Breakdown
This report shows how many different domains are being used to load content on the website. The more requests needed from 3rd party resources, the longer the load time.
Processing
The processing test shows what the main thread is doing at a point in time and can help you understand where bottlenecks may be happening with loading.
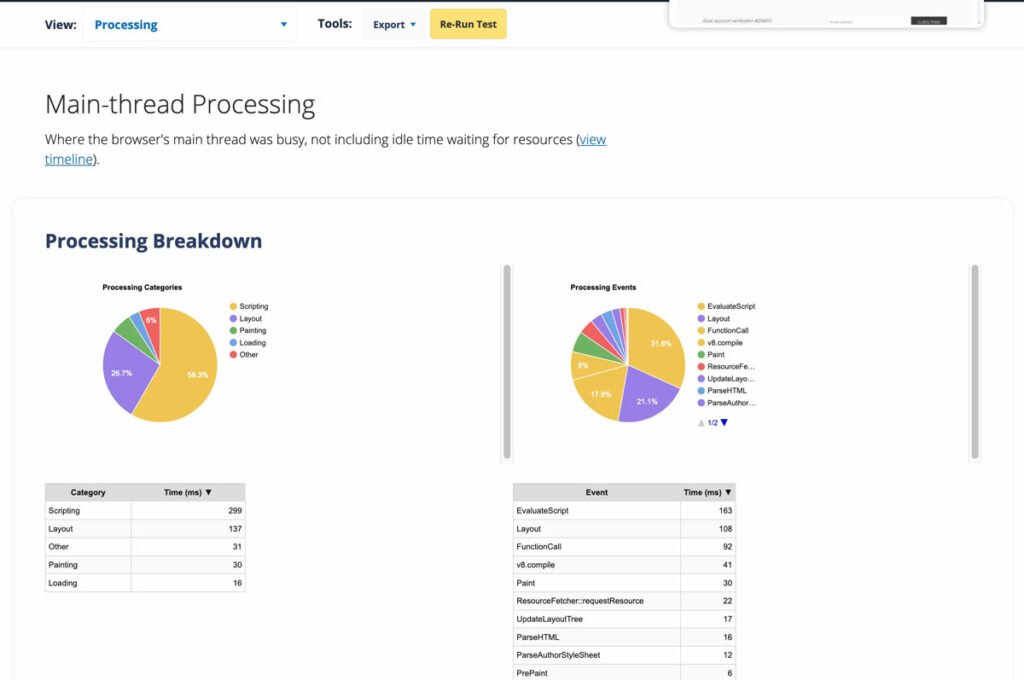
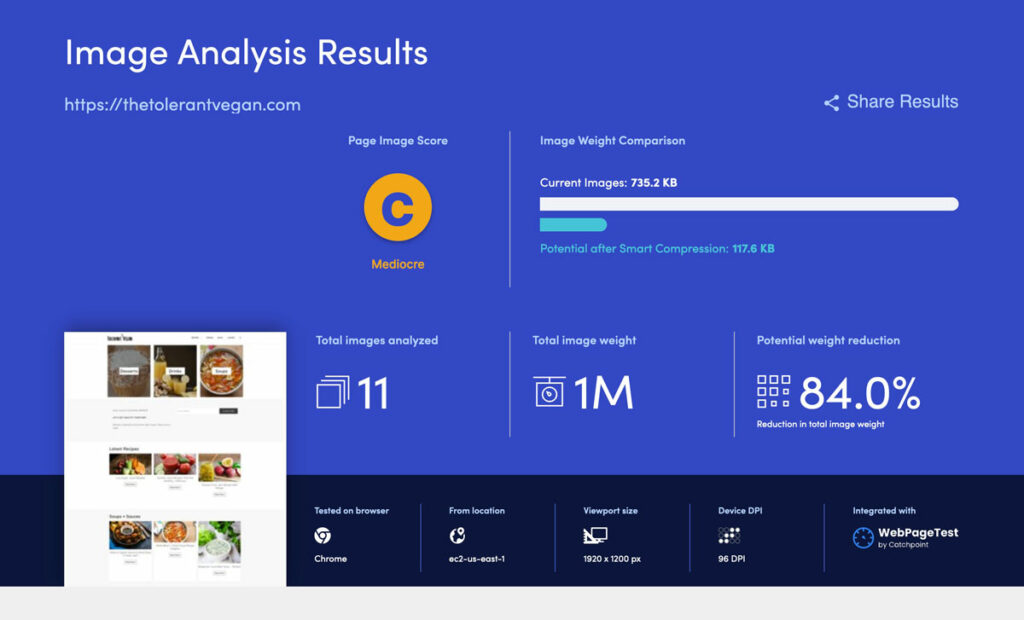
Image Analysis
Images are typically one of the biggest issues when it comes to site speed! The image analysis tool in Webpagetest is a great way to get some insight into the images that are causing the most issues on your tested page.
The tools is powered by Cloudinary which is a solution for improving images for any website. Download the Cloudinary plugin for WordPress to help you quickly optimize your images.
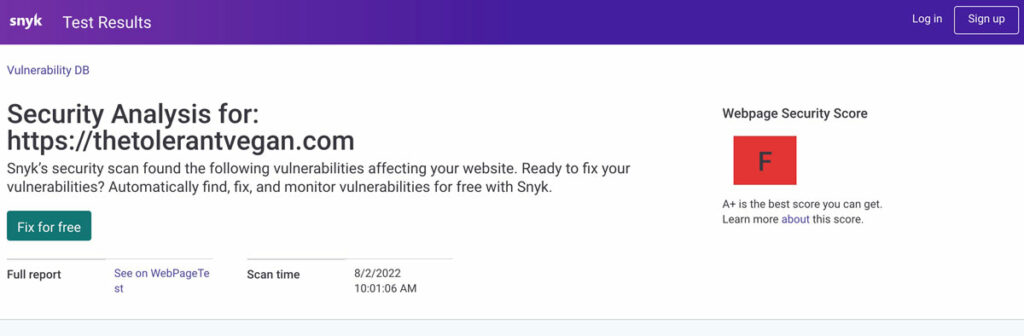
Security Score
The security score can help you understand how vulnerable your website to be for hackers or code injections. This is important as it can affect your users, so having a good score is really important.
Webpagetest uses snyk to help with this part of the testing. You can also run a header test at SecurityHeaders.
There are also features called request maps and data costs, which I will not cover in this article.
Stay tuned for more posts on how to actually fix the issues once you find them. All upcoming tutorials will be written for WordPress websites only.